For most of us debugging sounds somewhat scary or whatsoever we wouldn't like to do. But in fact you could easily turn it into a hunt game, it's just a matter of a weapon you choose. You could look through all your code with a microscope, you could try hitting it with a stick blindfold but in XXI century they have something else to do that.
An ultimate solution would be using a special PHP debugger like XDebug. Here some tutorials for using XDebug with powerful IDEs:
In this tutorial we will go oldschool which means that we won't use any special tools for debugging rather than PHP and Cotonti itself. Why would you ever do that? XDebug is a PHP extension which is not available on every server, it also requires a little of effort to install on your local host. Also there are just people who are used to doing such things by hand, so let's make their life easier with built-in Cotonti debugging facilities.
To use built-in debugging tools you should enable debug mode in config file datas/config.php:
$cfg['debug_mode'] = true;
or include debug core module manually:
require_once $cfg['system_dir'].'/debug.php';
The easiest thing to do if you want to learn a value of some variable is to print it. But in Cotonti there is output buffering and template engine which doesn't let do such prints directly wherever you like. To do it on a blank screen use cot_print() function, e.g.
$qa_abuse = ($usr['id'] == 0 || $row['fp_posterid'] == $usr['id'] ? ''
     : cot_rc_link(cot_url('plug', 'e=modcp&m=report&post='.$row['fp_id']), $L['qa_report_abuse'];

// <DEBUG>
cot_print($usr['id'], $row['fp_posterid'], $qa_question); // print these vars
// </DEBUG>

$qa_best = ($qa_question['q_state'] == QA_QUESTION_OPEN && $usr['id'] == $ft_firstposterid) ?
// ...
You can pass as many variables as you like. It will print their structure like this: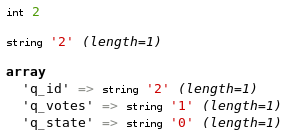
The problem about cot_print() is that it breaks script execution, so you have called it you can't know what would happen next. To see what happens to variables you could set watches on them. In Cotonti we have a kind of "manual" watches which don't trace the variables automatically but dump variables into a debug log file.
Before you can use cot_watch() and other debugging functions which use the debug log file, you should specify a path to that file in datas/config.php:
/**
 * Path to debug log files used by functions which dump debug data into it.
 * This path MUST NOT be available to strangers (e.g. via HTTP) or it can
 * compromise your website security. Protect it with .htaccess or use some
 * path accessible to you only via FTP.
 */
$cfg['debug_logpath'] = '/tmp';
Notice the date part in the file name: it makes a unique log file for every debug execution.
Wherever you want to save the variables for analysis just call cot_watch() on them:
cot_watch($my_var, $my_array, $obj->id, $arr['item']);
You can call cot_watch() as many times as you want, all it does is logging the values with location provided. After script execution you can open the log file and see how the values changed during execution.
Backtrace is a full sequence of files included and functions called (with their argument values) up to the moment the backtrace is performed.
The most common case is when your site breaks with a fatal error in SQL query and you have no idea where this query is located. You can help yourself by enabling debug output in datas/config.php:
/**
 * Defines whether to display debugging information on critical errors.
 * Set it TRUE when you experiment with something new.
 * Set it FALSE on production sites.
 */
$cfg['debug_mode'] = TRUE;
Then if an SQL error happens, you will see a backtrace which will help you to find a reason: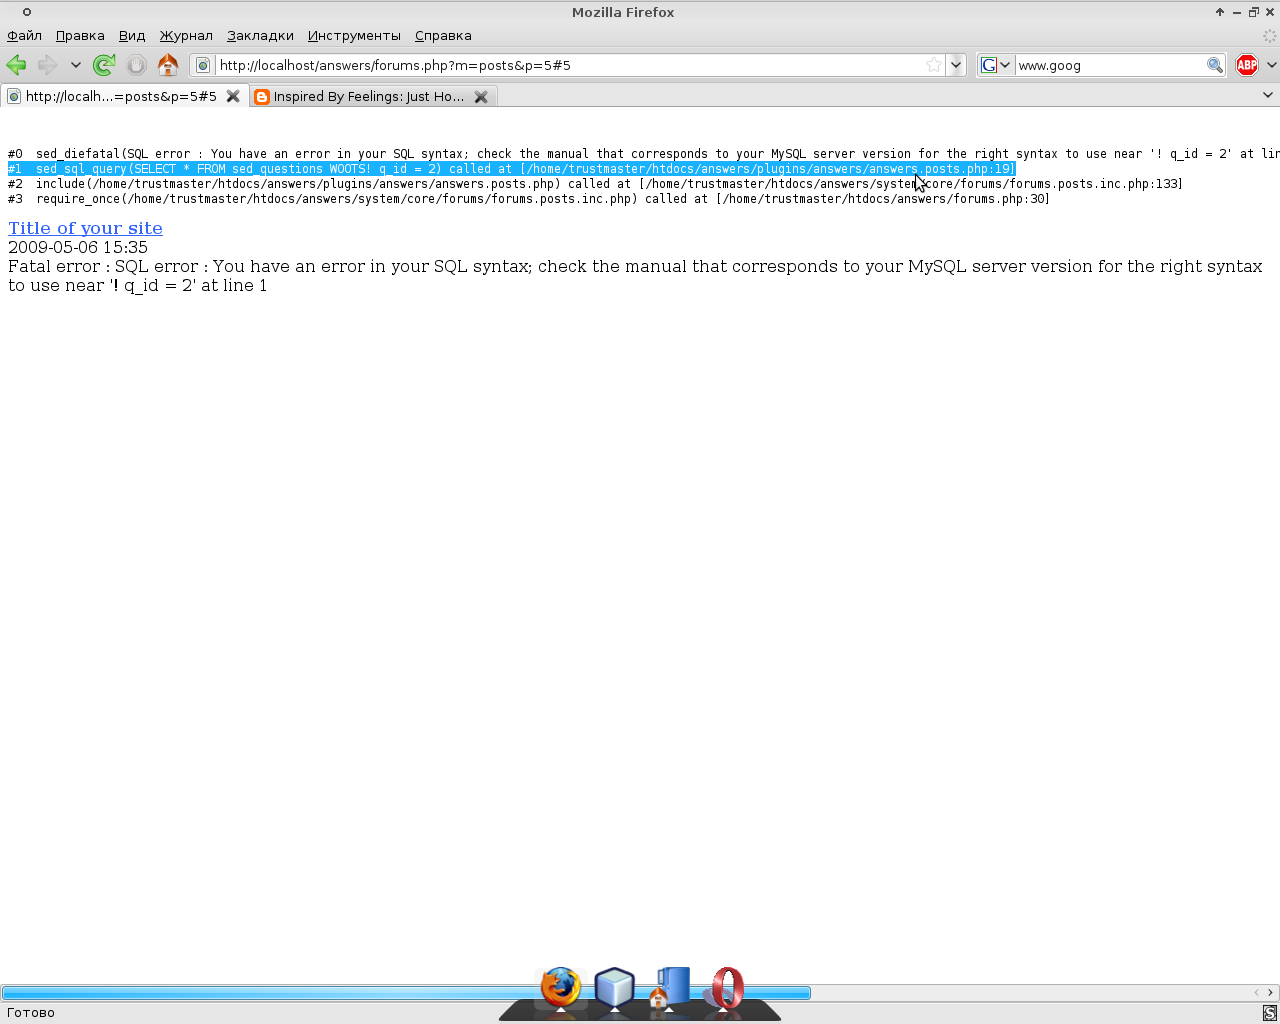
You also might find useful printing backtraces in your scripts when necessary. Use cot_backtrace() for that:
cot_backtrace(); // show me the call stack, please
Some functions like cot_backtrace() have $clear_screen argument which defaults to TRUE. If you pass it as FALSE it won't blank the screen and try to output results in normal page body:
cot_backtrace(FALSE); // don't blank the screen
Watches and backtraces are not enough if you want to perform a deeper variable analysis. In this case vardumps and checkpoints will help you.
cot_vardump();
will print complete structure and contents of global variables available for the moment cot_vardump() is called. It is usually a huge HTML page, so you will need Ctrl+F to get the the variable you are interested in.
If you are debugging a function and are interested in variables in the local scope, use COT_VARDUMP_LOCALS macro in this case:
function foo($arg1, $arg2)
{
	global $cfg;
	$my_var = 'test';

	eval(COT_VARDUMP_LOCALS);
}
It will print contents of $arg1, $arg2, $cfg and $my_var as the only variables available in its scope.
You might find it more handy to dump variables into log file instead of breaking the script flow. Debuggers use concept of breakpoints for this: you can set breakpoints and run your program step by step, stopping on each breakpoint and analyzing the variables. With PHP alone we can't pause and resume the script whenever we click a button in a text editor, so we use checkpoints instead.
When the checkpoint is met, the script opens the log file and writes where it is now and what the global or local variables contain. You can set several checkpoints, so you can get an extremely detailed image of what your script does during one debug execution.
Let's show you how we use checkpoints when debugging a real Cotonti plugin.
Here I want to see what's wrong with values within a function which syncs user level with his scores. To make it possible, I use COT_CHECKPOINT_LOCAL macro this way:
function qa_sync_scorelvl($user_id = NULL)
{
	global $usr, $qa_levels, $db_users;
	if (is_null($user_id))
	{
		$user_id = $usr['id'];
		$urr['score'] = $usr['score'];
		$urr['scorelvl'] = $usr['scorelvl'];
	}
	else
	{
		$urr = qa_get_score($user_id);
	}

	// <DEBUG>
	eval(COT_CHECKPOINT_LOCALS); // dump locals
	// </DEBUG>

	if (isset($qa_levels[$urr['scorelvl'] + 1])
		&& $urr['score'] >= $qa_levels[$urr['scorelvl'] + 1]['minscore'])
	{
		// ...
	}
	// ...
	return $urr['scorelvl'];
}
Then I perform some actions in my web browser which lead to this function call and open a log file, where I see something like this:
/home/trustmaster/htdocs/answers/plugins/answers/inc/points.php, 184:
user_id = 2
usr = Array
(
    [id] => 1
... ETC.

    [score] => 4
    [scorelvl] => 6
    [logpoint] => 1241583533
    [isadmin] => 1
    [auth_write] => 1
    [auth_read] => 1
)

qa_levels = Array
(
    [0] => Array
        (
            [name] => None
            [minscore] => -1000
        )

    [1] => Array
        (
            [name] => One
            [minscore] => 0
        )

    [2] => Array
        (
            [name] => Two
            [minscore] => 50
        )
... ETC.
)

db_users = cot_users
urr = Array
(
    [0] => 76
    [1] => 2
)

----------------
I pay attention for urr = Array and see that the indexes are numeric, whereas this function expects associative keys. Then I solve this problem and this function works fine.
Then I need to debug a part of a plugin which acts in global scope. So I use cot_checkpoint() function:
$qa_abuse = ($usr['id'] == 0 || $row['fp_posterid'] == $usr['id'] ? ''
     : cot_rc_link(cot_url('plug', 'e=modcp&m=report&post='.$row['fp_id']), $L['qa_report_abuse'];

// <DEBUG>
cot_checkpoint(); // dump globals
// </DEBUG>

$qa_best = ($qa_question['q_state'] == QA_QUESTION_OPEN && $usr['id'] == $ft_firstposterid) ?
// ...
The log file is quite a big one because each complete dump is about 1 MB (which is by far less than in most website engines though). So I use search in my text editor to find variables I am interested in: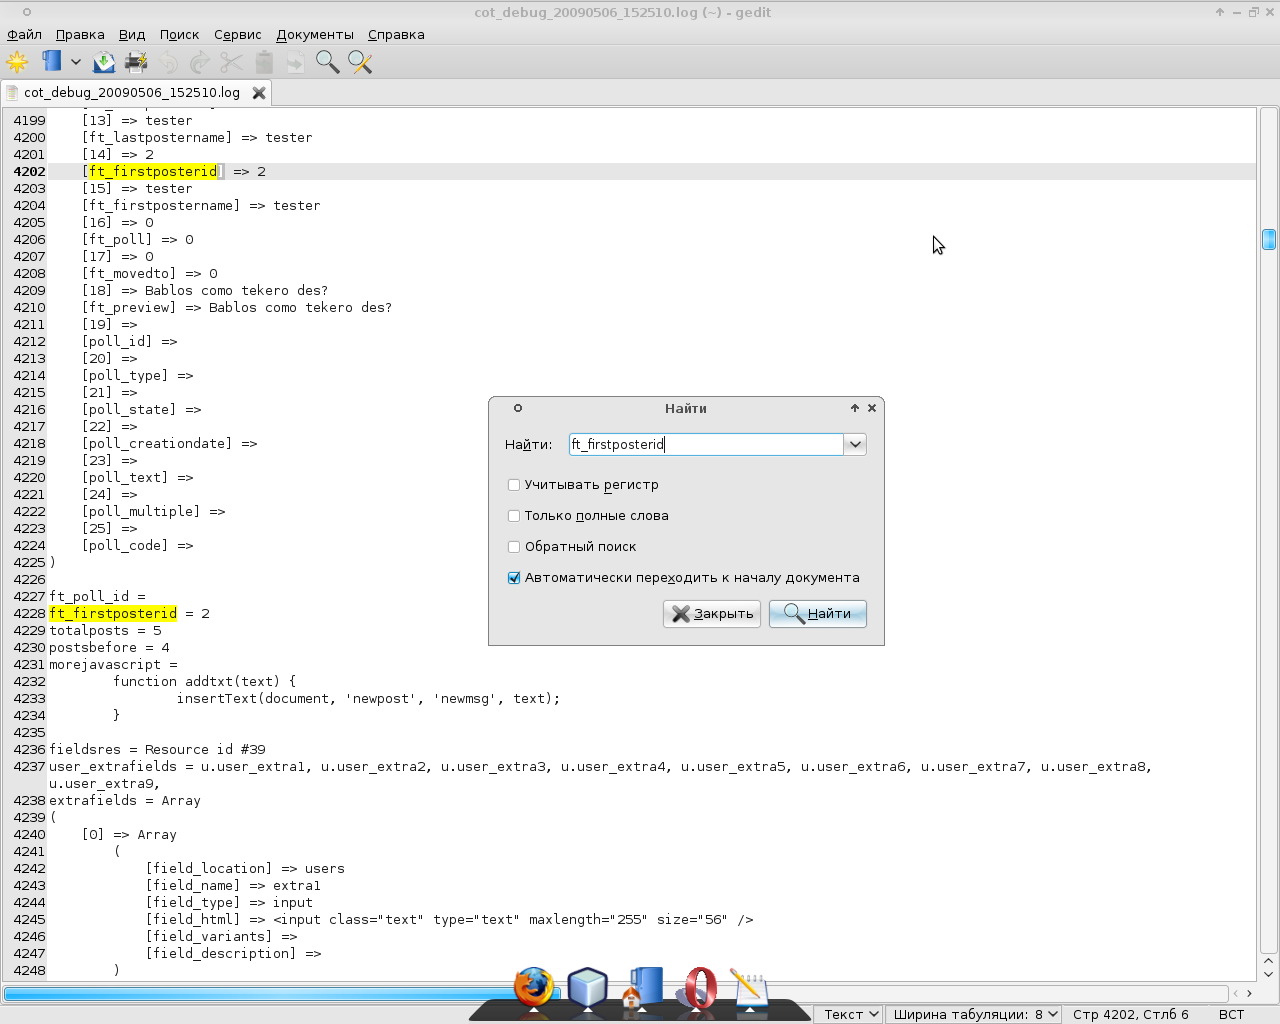
Sure these simple functions are not as handy as a dedicated debugger utility (if you know how to use it though). But I'm sure they can make your life easier if you have ever thought of adding something like "echo 'What is wrong here?'" in your code.
And remember that debugging is much more fun than you usually think of it. Just take your machine gun and have some beasts fried tonight!


12 tijden